
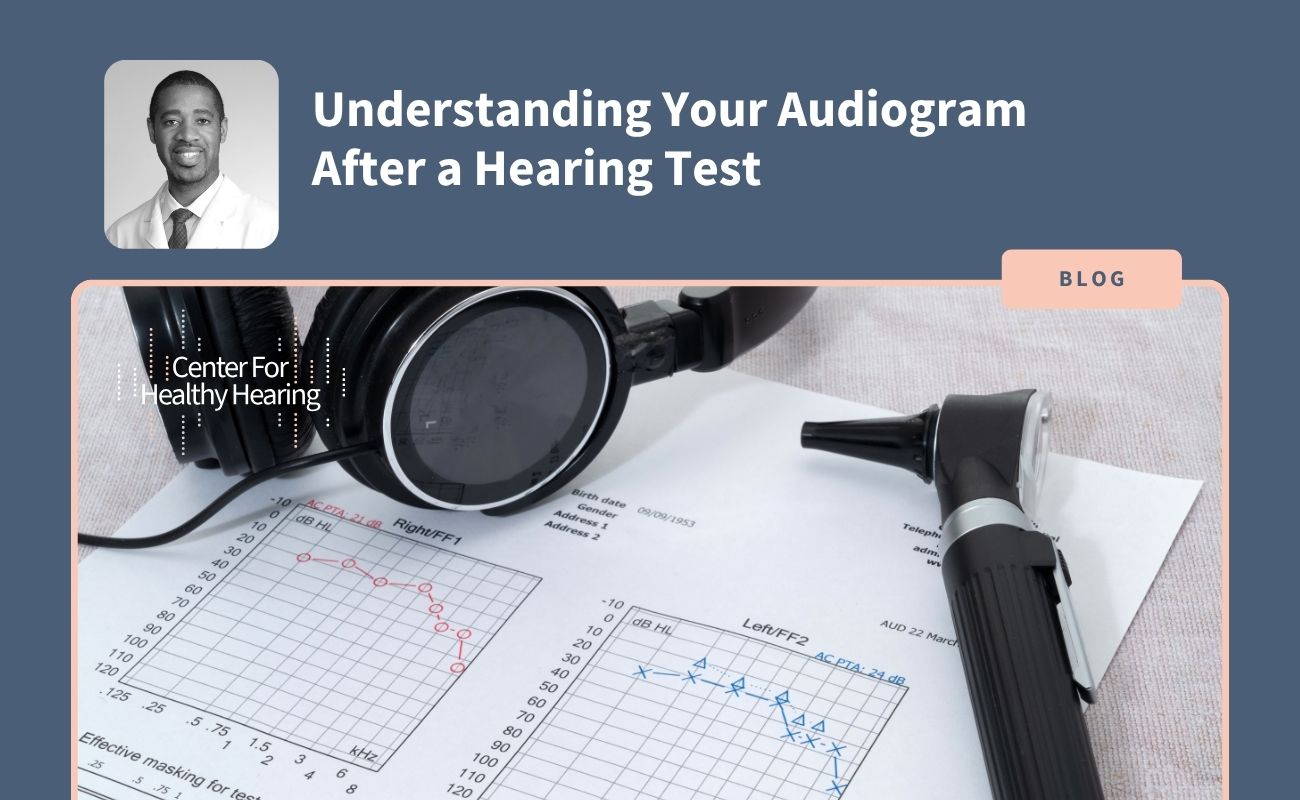
You just finished a hearing test, and the audiologist hands you a chart covered in X's and O's. No pass or fail. No obvious takeaway. You leave with more questions than answers, which is frustrating when you're trying to understand something as personal as your own hearing. Here's the thing: that chart, called an audiogram, is actually packed with useful information once someone walks you through it.
How to Read the Chart
Think of your audiogram as a map. The horizontal axis runs from low pitches on the left (like a bass drum) to high pitches on the right (like a bird chirping or the letter "s"). The vertical axis measures volume in decibels. Here's where most people get tripped up: softer sounds sit at the top of the chart, louder sounds at the bottom.
Each ear gets its own symbol. Red circles represent your right ear, blue X's your left. Wherever a symbol lands shows the quietest sound you could hear at that pitch during testing. That point is your hearing threshold.
Normal hearing falls between 0 and 25 decibels. If your symbols drop below that range, you needed a louder sound to detect that pitch, which means some degree of hearing loss is present at that frequency.
What the Shape of Your Results Means
The pattern of your audiogram matters just as much as how far down the symbols fall. Different shapes point to different causes, and they explain the specific listening struggles you might be noticing in daily life.
The most common shape is a sloping pattern, where hearing is near normal on the low-pitch side and drops off toward the higher pitches. This is typical with age-related or noise-related hearing loss. It's also why so many people say they can hear someone talking but can't quite make out the words. Consonants like "s," "f," and "th" live in that high-frequency range and tend to go first.
A flat pattern means the loss affects all pitches roughly evenly. A cookie-bite pattern dips in the middle frequencies, and it's associated with genetic or congenital hearing loss. A rising pattern, where low pitches are harder to hear than high ones, is less common but does show up.
Conductive vs. Sensorineural Loss
Your audiogram can also reveal what type of hearing loss you have, which matters a lot for figuring out next steps.
Conductive loss means something is blocking sound before it reaches your inner ear, such as fluid, earwax buildup, or a middle ear problem. It's often treatable or reversible. Sensorineural loss involves the inner ear or auditory nerve itself. It tends to be permanent, but it's very manageable with the right hearing aids. In many cases, your audiologist can determine which type you have just from looking at your results.
Why the Degree of Loss Matters
Audiologists categorize hearing loss as mild, moderate, moderately severe, severe, or profound. These labels aren't just for paperwork. They shape the conversation about what comes next. Someone with mild high-frequency loss might do fine in quiet, one-on-one conversations but really struggle at a noisy dinner table or in a group setting. Someone with moderate to severe loss across all pitches is going to feel that gap much more consistently.
It's also worth knowing that your audiogram doesn't tell the whole story about speech understanding. Two people with nearly identical-looking charts can process spoken words very differently. That's exactly why word recognition testing is often done alongside the standard hearing test, since it fills in that gap.
What Comes Next After Your Results
Once you understand your audiogram, the real question is what to do with it. For some people, the answer is simply monitoring things with a follow-up test in a year. For others, it means exploring hearing aid options that are matched to their specific pattern of loss. A device built for high-frequency loss isn't the right fit for someone with a flat or cookie-bite pattern, so the shape of your results genuinely guides the recommendation.
If your hearing changed suddenly, or if the loss only showed up in one ear, that warrants a closer look sooner rather than later. Those patterns can sometimes point to something that needs prompt attention.
Your audiogram is a snapshot in time. Reading it correctly is how you and your audiologist figure out the right next step together.
Come Get Your Results Explained Clearly
Dr. Ike Iheagwara and the team at Center for Healthy Hearing walk every patient through their results in plain language, no chart-reading background required. Whether you've had a test somewhere else and still aren't sure what it means, or you're ready to schedule your first one, call us at 212-920-1970. We're at 161 Madison Avenue in NoMad, and we're happy to help you understand where things stand and where to go from here.
.jpeg)

.png)